 Today is the hands-on working with data in R. Come to class with computers and let’s start off class by getting into your groups.
I’ll assume that you’ve read the Kieran Healy post for today. Here,
First, download the data, and put it in the appropriate folder. Open RStudio, and create a new project in your revere folder. Open Healy’s R script.
Second, look at the Excel spreadsheet and talk about what you see there.
Third, before coming to class, do some googling (or you can find it in the SNA books that I’ve put on the reading list), and tell me what the difference is between betweeness centrality, eigenvector centrality, and the Bonacich power centrality. Decide as a group which one you would use, and let’s graphically play with node size to represent your groups.
Bonus points if you can find the original article on the bad link on Healy’s webpage.


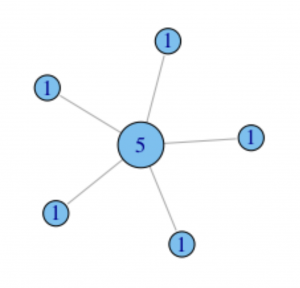
- degree centrality: the number of nodes connected to a node, normalized for the total number of nodes – connectedness
- betweenness centrality: number of nodes that pass through a node, given the shortest path for all nodes; importance comes from connection to other nodes – importance as intermediary, connector
- influence, presige – not what you know but who you know
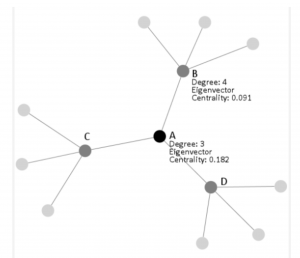
eigenvector centerality: measure of the neighborhood around a node, where the centrality of the nodes that a node is connected to is taken into account; normalized - Bonacich power measure – similar to eigenvector centrality, based on degree centrality of neighboring nodes; difference is in mathematical calculation, where increasing distance from a node has less effect (or closer nodes have more of an impact)
